Where are the Food Hubs in the US? A really interesting analysis was done by researchers at the University of Illinois, and it looks like Los Angeles County is still the big dog.
This, in spite of falling from its major ranking as a significant growing area in the 1950s, it is still shipping large amounts of food as are most of the coastal transfer hubs. The data here comes from a condensation of a journal article that you can read in full following this link: https://iopscience.iop.org/article/10.1088/1748-9326/ab29ae
The condensation titled “We mapped how food gets from farms to your home” by Megan Konar can be found at: https://theconversation.com/we-mapped-how-food-gets-from-farms-to-your-home-125475
A summary of that summary follows:
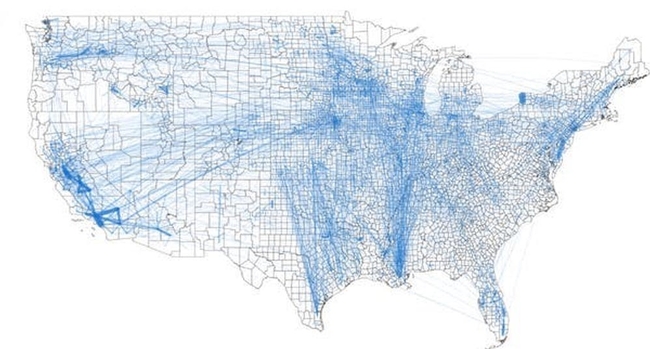
This map shows how food flows between counties in the U.S. Each line represents the transportation of all food commodities, along transit routes, like roads or railways. Environmental Research Letters (2019), CC BY-SA
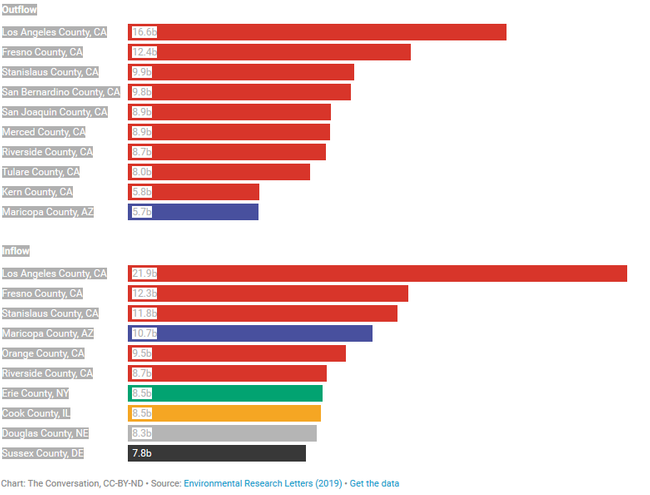
At over 17 million tons of food, Los Angeles County received more food than any other county in 2012, the study year. It shipped out even more: 22 million tons.
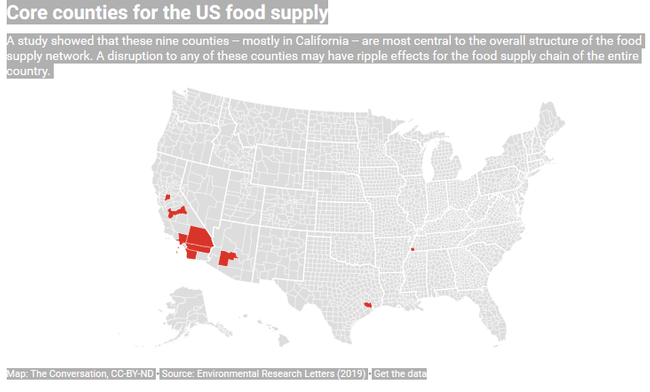
California's Fresno County and Stanislaus County are the next largest, respectively. In fact, many of the counties that shipped and received the most food were located in California. This is due to the several large urban centers, such as Los Angeles and San Francisco, as well as the productive Central Valley in California
In 2012, Los Angeles County both shipped (outflows) and received (inflows) more kilograms of food than any other U.S. county. Other California counties ranked highly in both categories.
These are just some of the food statistics of where and how food gets around the country found at the website :
https://theconversation.com/we-mapped-how-food-gets-from-farms-to-your-home-125475
Food flows between counties in the United States
Xiaowen Lin1, Paul J Ruess1, Landon Marston2 and Megan Konar1,3
Published 26 July 2019 • © 2019 The Author(s). Published by IOP Publishing Ltd
Environmental Research Letters, Volume 14, Number 8
https://iopscience.iop.org/article/10.1088/1748-9326/ab29ae
Abstract
Food consumption and production are separated in space through flows of food along complex supply chains. These food supply chains are critical to our food security, making it important to evaluate them. However, detailed spatial information on food flows within countries is rare. The goal of this paper is to estimate food flows between all county pairs within the United States. To do this, we develop the Food Flow Model, a data-driven methodology to estimate spatially explicit food flows. The Food Flow Model integrates machine learning, network properties, production and consumption statistics, mass balance constraints, and linear programming. Specifically, we downscale empirical information on food flows between 132 Freight Analysis Framework locations (17 292 potential links) to the 3142 counties and county-equivalents of the United States (9869 022 potential links). Subnational food flow estimates can be used in future work to improve our understanding of vulnerabilities within a national food supply chain, determine critical infrastructures, and enable spatially detailed footprint assessments.
Author
Assistant Professor of Civil and Environmental Engineering, University of Illinois at Urbana-Champaign
Disclosure statement
Megan Konar receives funding from the University of Illinois at Urbana-Champaign. National Science Foundation funding has supported research related to this article.


