The best key to unlock efficient irrigation practice is to know exactly how much water your crop uses and replace it in a timely fashion that matches your irrigation system capacity and avoids crop stress and water logging. We have good “normal year” estimates of citrus water use (evapotranspiration, ET) for the San Joaquin Valley, but as any grower knows very few blocks are “normal”. The Frost Nucellar on the Cajon loamy sand and fanjets in Edison doesn't behave the same as Fukumoto navel planted to double-line drip on an Exeter clay loam.
So what's the trick for hitting optimum water management for a particular block? You have to keep account of your soil moisture reservoir in the crop root zone. Tracking soil moisture tells you whether you're putting on too much or too little water to meet crop needs. It's also the key to increasing fruit set and quality in many crops such as canning tomatoes, improving flavor in most wine grape varieties and possibly help control puff and crease in citrus.
But any farmer and most ag consultants will tell you that checking soil moisture is not for the faint of heart because it requires auguring holes, pushing a steel probe tube, and/or installing soil moisture monitoring instruments to depths of 2 to 6 feet depending on the crop. Checking instruments or hand probing needs to be done on at least a weekly basis to be useful.
After pushing, twisting, pounding and digging thousands of holes in hundreds of fields around the San Joaquin Valley I can testify to the fact that this is only slightly more fun than shoveling manure, and it's a whole lot harder on your shoulders and wrists. The result is that it's not done very often, if at all, and farmers tend to stick to a traditional irrigation schedule. Given all the other decisions and details growers have to see to on a daily basis it's not surprising this activity gets pushed to the side. At the same time, the years of experience a farmer has with a crop and with a particular field often give him an intuitive sense of how to run the water and end up being 75 to 90% efficient anyway! So if you're already this efficient then why auger holes and check moisture anyway?
There are two reasons: 1) You're not really sure that you're at the optimum point of the crop water use curve until you check, and 2) The simple math of cost versus benefit. Water monitoring consulting services run around $15/acre/season depending on total acreage and what degree of technology and reporting you want done. If this is the only cost you incur to get the extra 5% out of a 3-bale cotton crop then you've made an extra $22/acre even if cotton is only 50 cents/lb. Even at just $2 net/box, the total from an extra 15 boxes of grapes or extra fancy oranges is a 100% return on your $15 investment.
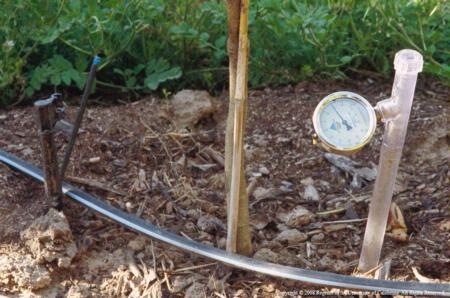
Many growers have tried tensiometers in the past and usually get fed up with the maintenance. A new generation of medium and high technology sensors is now available to growers and consultants. The huge diversity of sensors can be intimidating at first glance but these systems can make this job easier, more accurate and even more affordable. The biggest advantage to the new technology is the use of a continuously recording data logger coupled to responsive soil moisture sensors.
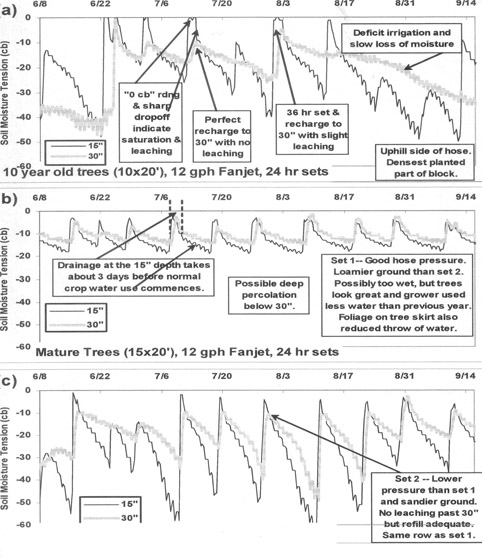
A series of irrigation management/monitoring demonstrations by UC Cooperative Extension over the last 3 years in Kern County has looked at using a combination of 6 granular matrix electrical resistance blocks (Watermark®) coupled to a logger with a graphic display (Hansen AM400®) to allow growers a “push button” look at 5 weeks of soil moisture history at any time during the season. The cost of this system is about $600 and should be good for 3 to 5 years. This gives growers a look at the dynamic changes in soil moisture due to actual crop water use and subsequent recharge of the profile during irrigation. The pattern of the peaks and rate of change of these readings is more useful than the actual numbers themselves. Many different sensors and loggers provide this type of information but the AM400/Watermark system is the only combination providing a graphic display in the field without having to download to a computer. Computer downloads can also be done anytime during the season to develop charts such as those shown below.
Charts (a), (b) and (c) show the changes in soil moisture for 2 different blocks of early navels in the Edison area of Kern County for summer 2003. Comments are placed in boxes connected to explain what these patterns mean.

Even though all three of these monitoring locations are within 800 feet of each other we see very different changes in soil moisture. The hedgerow block (a) has many skips as the grower has begun pulling trees and he wants to avoid over watering the whole block.NEW PARA Charts (b) and (c) are for trees in the same row but different sets. Slightly higher hose pressures and loamier ground keep (b) moister than (c), which shows almost a perfectly efficient pattern of crop water use and recharge. To keep the trees in (c) from looking “hot” required an irrigation frequency for this block that resulted in the wetter condition at location (b). But the bottom line for the grower is these trees have never looked better, he used less water in 2003 and had a better packout than in 2002.
Checkout my website,for some calibration curves and other field examples, both good and bad, under “Using Watermarks in Different Soils”. Irrometer, Onset and Spectrum companies also make inexpensive loggers (can be found here. (Note: use of any product names is not intended as a commercial endorsement.)
